-
Nebular Spectrographs circa 1910
Vesto Slipher (1913) was the first to formally state the rather interesting fact that the "speed" with which an astronomical spectrograph detects an object of uniform surface brightness is independent of the telescope aperture, where telescope aperture refers to the telescope that feeds light to the input slit of the spectrograph. The history of the nebular spectrograph, and how it fits into the broader history of astronomical spectroscopy, was recently reviewed by Thompson (2013).
In about 1910, Vesto Slipher started using the 24-inch refractor at Lowell Observatory to detect the spectra of spiral nebula. He was competing primarily with Edward Fath (then a graduate student at Lick Observatory). Fath at first used the Crossley 36-inch reflecting telescope at Lick Observatory and later used the 60-inch reflecting telescope at Mt. Wilson Observatory. It was in this competitive atmosphere that Vesto Slipher thought through the nebular spectrograph design problem. Long after Slipher described the results in his papers on the Doppler shifts of spiral nebulae, Ira Bowen (1952, 1964) worked through this problem algebraically.
Both Slipher and Fath selected large entrance slits for their work: Fath's was 5.8 arcsec wide and Slipher's 8.25 arcsec wide. Slipher used an f/2.5 spectrograph camera, and Fath used one camera lens that was f/3 and another that was f/2. Their targets--the cores of nearby galaxies--actually did not have a uniform surface brightness.
|
|
-
The Nebular Spectrograph Problem:
The operation of a nebular spectrograph can be understood as follows. The surface brightness of an extended object cannot be enhanced by any telescope. Telescopes alter the image scale, but they do not change an extended object's surface brightnes (the measured flux per Angstrom per square arc second on the sky). While spectrograph design involves a complex interplay of several variables, it can be stated generally that for a given detector (i.e. a detector with fixed pixel dimensions in microns), the detected flux per unit wavelength depends not on telescope aperture but on the f/ratio of the spectrograph camera that feeds the detector.
|
-
The New Nebular Spectrograph
The detector in the new spectrograph is a 2048x2048 CCD with individual pixels 15x15 microns. The spectrograph camera is a 50 mm focal length Carl Zeiss AR-coated f/1.4 multi-element lens. With a 30 mm collimated beam, the camera works at approximately f/1.67. At the collimator focus is a line of 14 optical fibers each with a core diameter of 50 microns. When the optical system is in perfect focus, the input fibers are Nyquist sampled at the detector. The disperser is a "volume phase holographic" (VPH) grating, and the final spectral dispersion is close to 1.3 A/pixel.
The input ends of the 14 optical fibers are held at the focal plane of a 0.25-m (10-inch) aperture telescope. The telescope feeds each fiber with a circular area on the sky of diameter 8.59 arcsec. When working on extended astronomical sources of uniform surface brightness, this system is essentially as fast as any astronomical spectrograph in the world. The wavelength response is highest where the VPH grating peaks: 5300 A.
The first on-the-sky exposures are shown below. These spectra were taken on the nights of Aug. 11 and Aug. 12, 2013, at Mt. Laguna Observatory, 45 miles directly east of San Diego, CA. The equatorial mount available for this first test run made it impossibe to find and track faint sky objects. A better equatorial mount (Paramount MX Robotic Telescope Mount from Software Bisque) will be available for the next observing run. Except for this difficulty, the entire system worked beautifully.
I thank the San Diego State University faculty and the Mt. Laguna Observatory staff for the opportunity to do this work from their excellent dark-sky observatory.
|
|
References:
Bowen, I.S. 1952. "The spectrographic equipment of the 200-inch Hale Telescope" ApJ, 116, 1.
Bowen, I.S. 1964. "Spectrographs" in Astronomical Techniques, ed. W.A. Hiltner (University of Chicago Press, p. 34.
Slipher, V.M. 1913. "The radial velocity of the Andromeda Nebula" Lowell Observatory Bulletin, v. 2, p. 56.
Thompson, L.A. 2013 "V.M. Slipher and the development of the nebular spectrograph" (arXiv: 1301.7331) published in "Origins of the Expanding Universe: 1912-1932" A.S.P. Conference Series, vol. 471, ed. M.J. Way & D. Hunter.
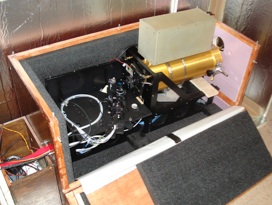
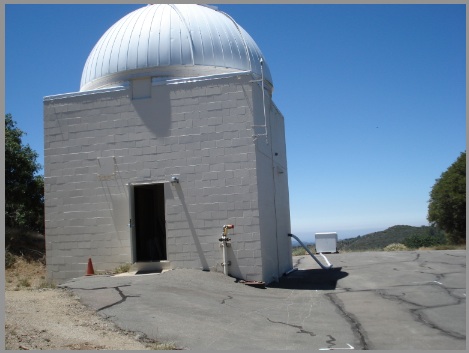
| The scene at Mt. Laguna Observatory: the nebular spectrograph sits in a darkroom in the 24-inch telescope dome (the large building on the left). In daytime the 0.25-m telescope is protected by its roll-off roof cover (visible in the far background). The two structures are connected with conduit holding control cables and the 20-m long fiber optic bundle. |
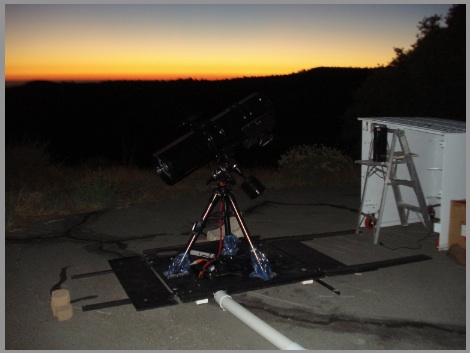
The 0.25 aperture telescope is shown here with its roof rolled off to the right. The fiber optic bundle, protected inside a red sheath, can be seen between the tripod legs dropping from the mount and traveling towards the conduit. |
 |
 |
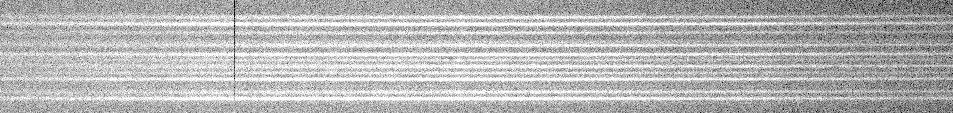
For the 50 sec. exposure shown above, the telescope was pointed towards a dark region of the Moon. The aim was to determine the relative throughput of the fibers. The spectrum is that of reflected sunlight, of course. Blue is on the left and red is on the right. These spectra cover wavelengths from ~5200A - 6000A. The image shows original raw data with no processing.
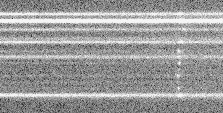
Above is an enlarged image of multiple spectra taken in the central region of M31. This unguided 30 min. exposure began with the galaxy nucleus initially centered on the second fiber (counting from the top down in this image), but since the exposure was unguided, the nucleus remained on this fiber for no more than 2 min. Those spectra with the least flux come from special "sky" fibers located 5 arcmin from the center of the main IFU. The wavelength range is 5275 A - 5640 A and includes the 5577 A night sky line (the set of dots on the spectra located to the right of center).
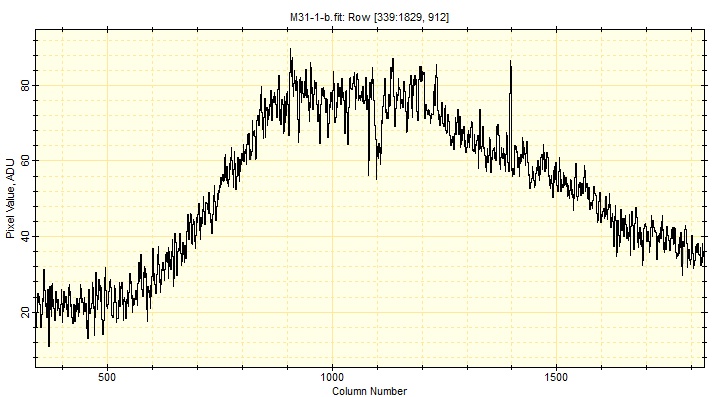
The second from the top spectrum (referring to the previous image) of the M31 nucleus was extracted over the wavelength range 4035 A to 6140 A. It is displayed here as a function of raw CCD counts. This image was bais-subtracted and flat fielded. However, the sky has NOT been subtracted. It HAS NOT YET been wavelength calibrated. It HAS NOT YET been flux calibrated. The 5577 A night sky emission line is easy to see as the spectral feature at pixel 1395.